📋 How to Run a Report

  1. Confirm you're viewing the correct event year. Check the top banner — it shows your active Event Name and start date. Click the date to switch to a different year if needed.
  2. In the Web Manager, go to Tickets & Analytics → Reports.
  3. Use the dropdown under Reports to select the report you want.
  4. Set your date range before running. Include one day before and one day after your event to capture all purchases and scans.
  5. Run the report. Use the Export / Download CSV option for the most complete data — exports typically include more detail than the on-screen view.
💡
Set the date range first — every time

This is the most common mistake. Reports default to narrow date windows. For ticket sale reports, set the start date to when sales opened. For scan reports, set it to event start through event end.

ℹ️
All times are Mountain Time (MST/MDT)

Report timestamps, including the Ticket Sales by Hour report, are in Mountain Time.
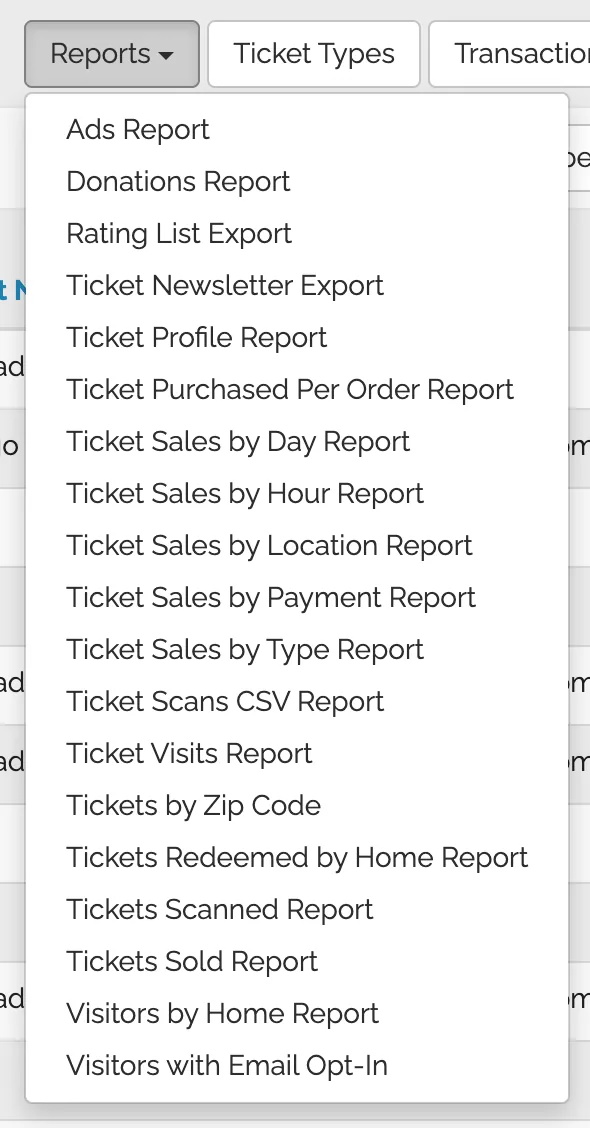
Where to find reports in Web Manager
__HOWTO__

📊 All Available Reports

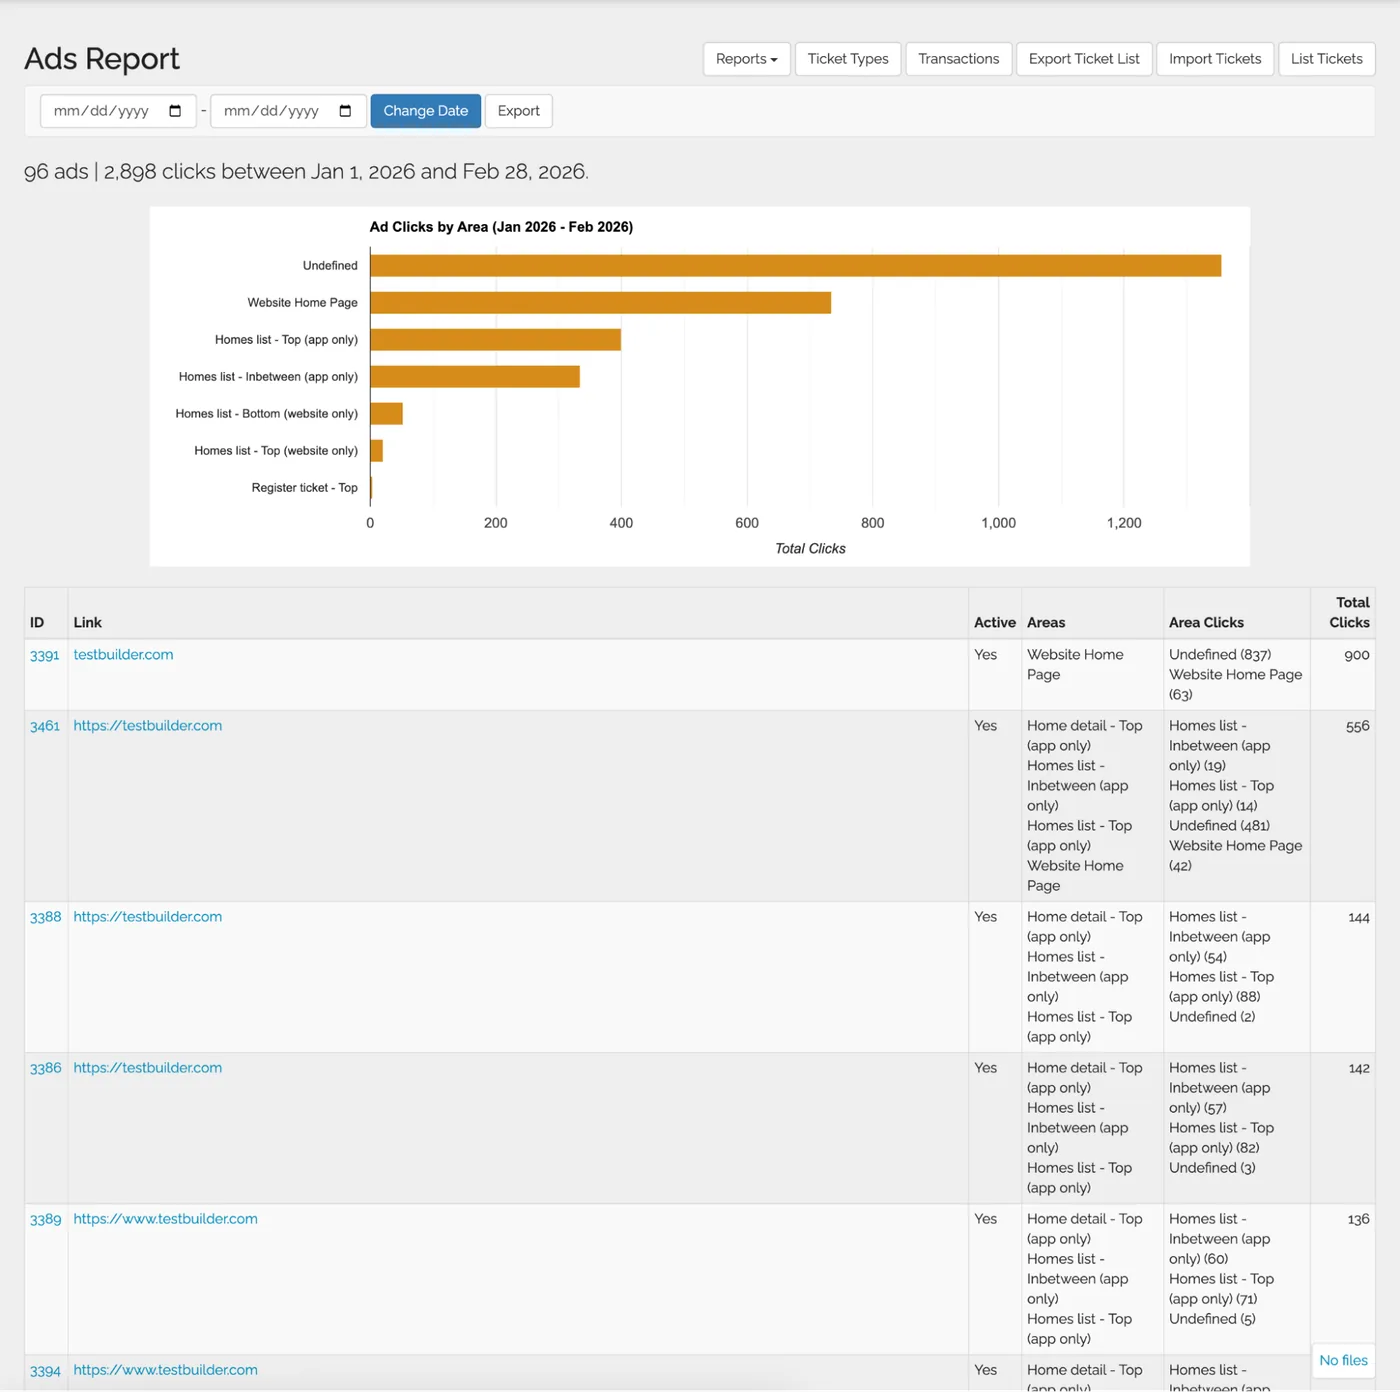
Ads Report screenshot
📢 Ads Report
Page shows:Ad performance — activity and engagement at a glance
How to read:Compare ad placements to see which are getting the most attention
Export includes: CSVAd ID, Link, Active, Areas, Area Clicks, Total Clicks
💰 Donations Report
Page shows:Donation totals and donation activity in the date range
How to read:Use totals for quick reporting; the list shows individual donations
Export includes: CSVDate, Donor, Amount
⭐ Rating List Export
Page shows:No on-screen view — export only
Export includes: CSVHome, Home Index, Review text
Ticket Newsletter Export screenshot
📧 Ticket Newsletter Export
Page shows:Contact list with newsletter opt-in status and home visit counts
How to read:Best for pulling email lists — simpler than the full Tickets Sold export
Export includes: CSVFirst Name, Last Name, Email, Newsletter, Future Plans, Postal Code, Sale Location, Homes Scanned
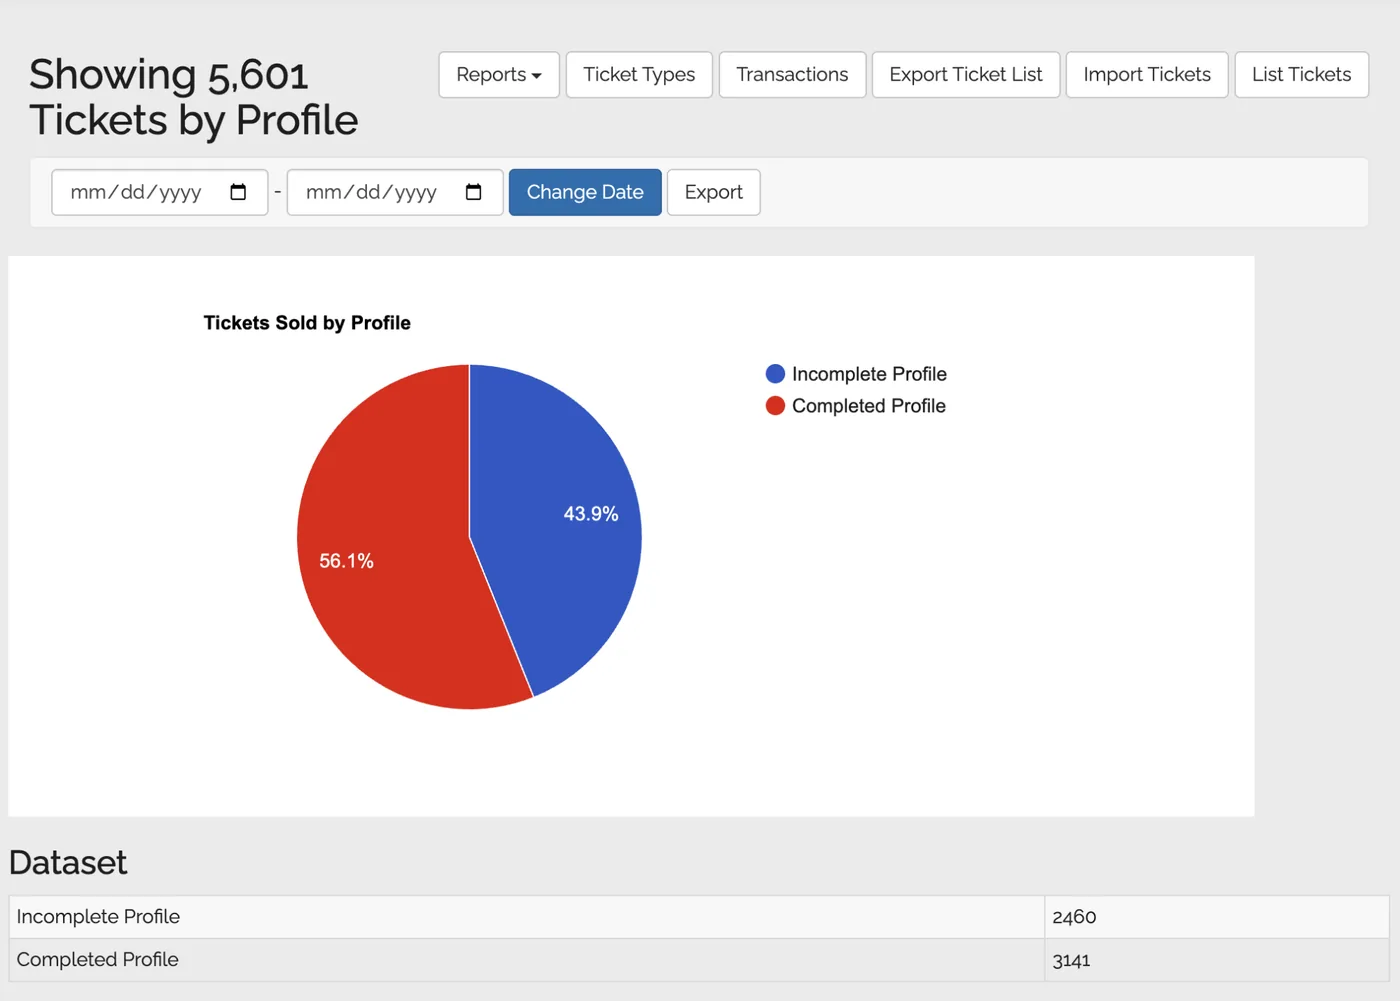
Ticket Profile Report screenshot
👤 Ticket Profile Report
Page shows:How many ticket holders completed their profile
How to read:Helps assess how complete your audience data is — useful for sponsor reporting
Export includes: CSVIncomplete Profile Count, Complete Profile Count
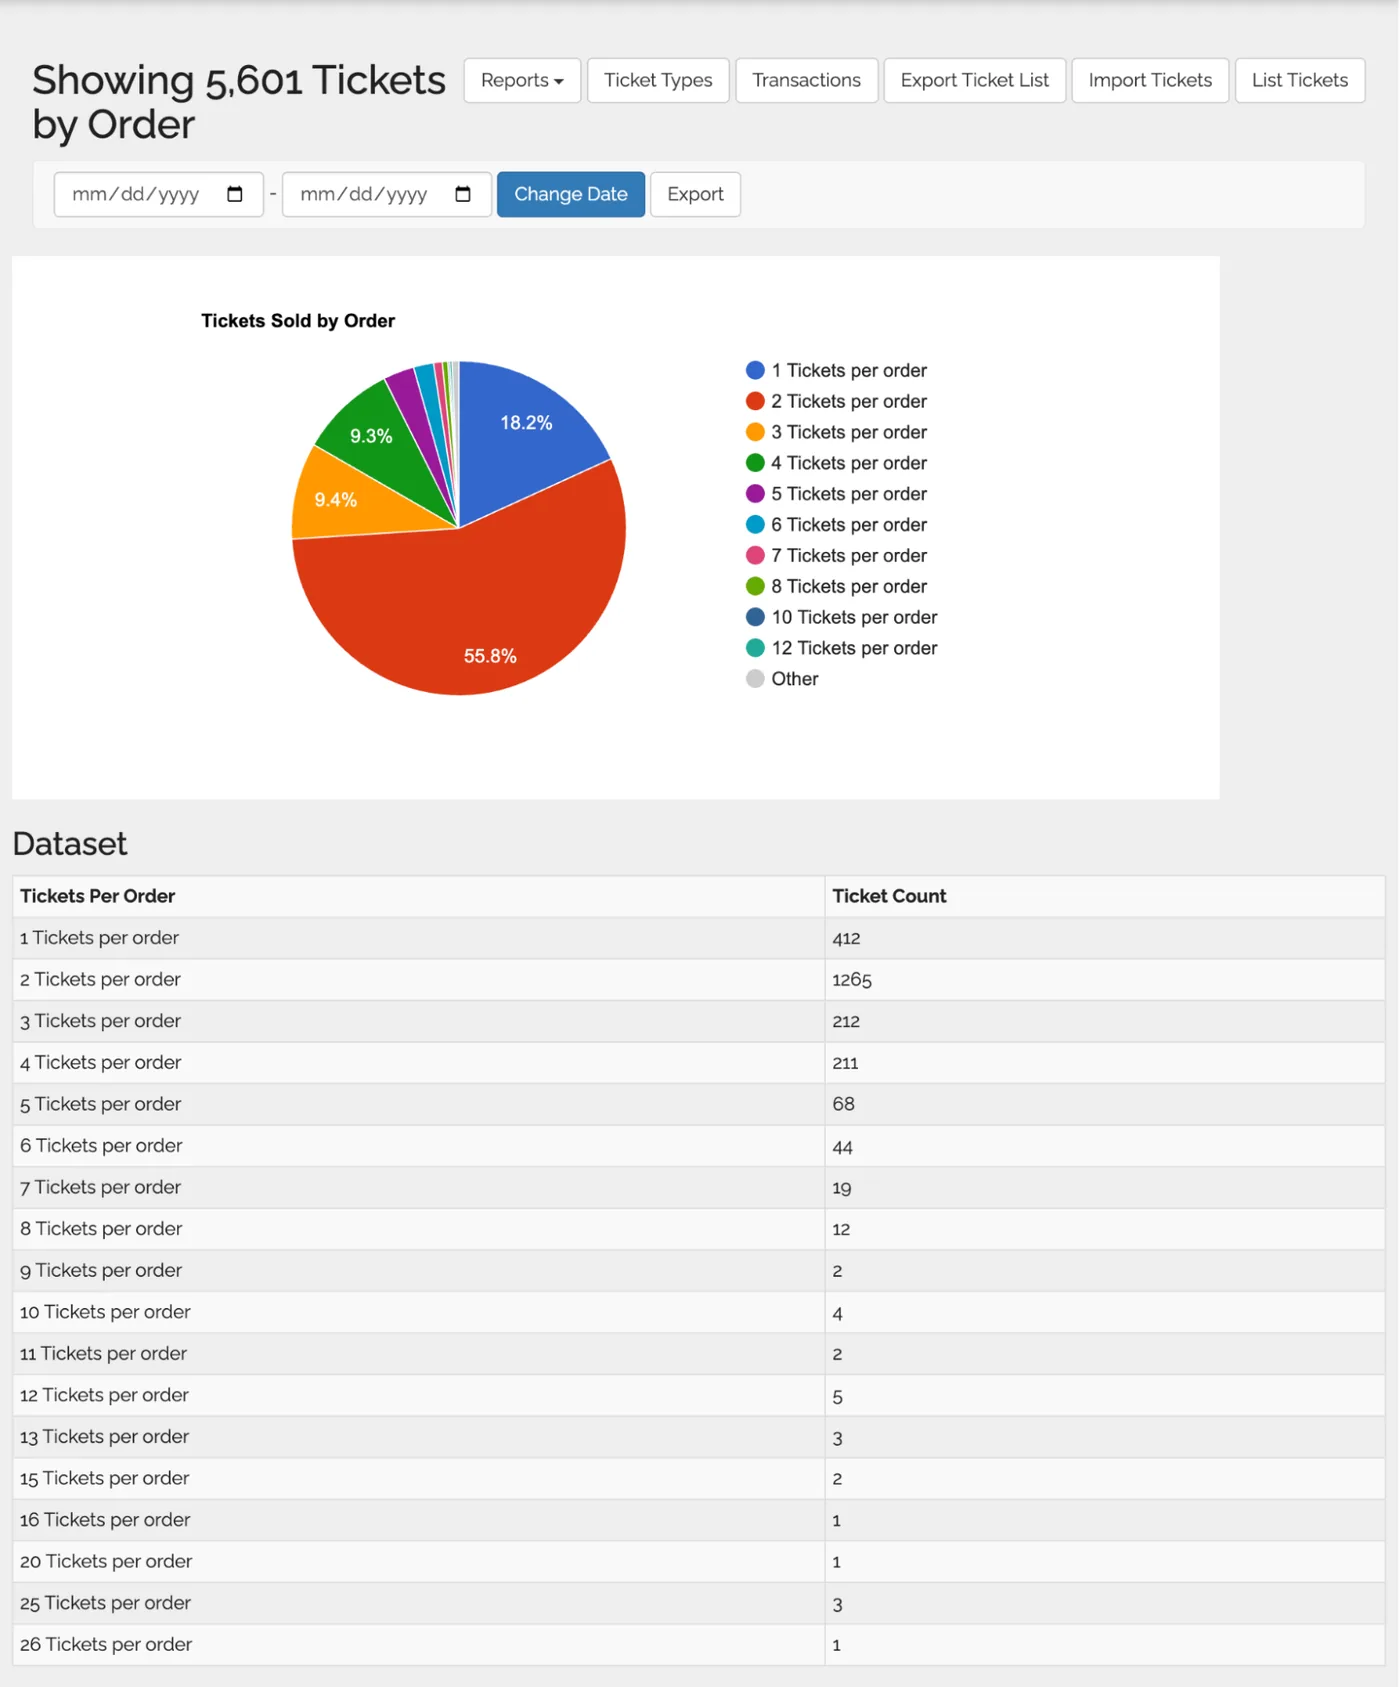
Ticket Purchased Per Order Report screenshot
🛒 Tickets Purchased Per Order
Page shows:Ticket purchases grouped by order size (1 ticket, 2 tickets, etc.)
How to read:Understand group buying behavior — how many people buy together
Export includes: CSVTickets Per Order, Ticket Count
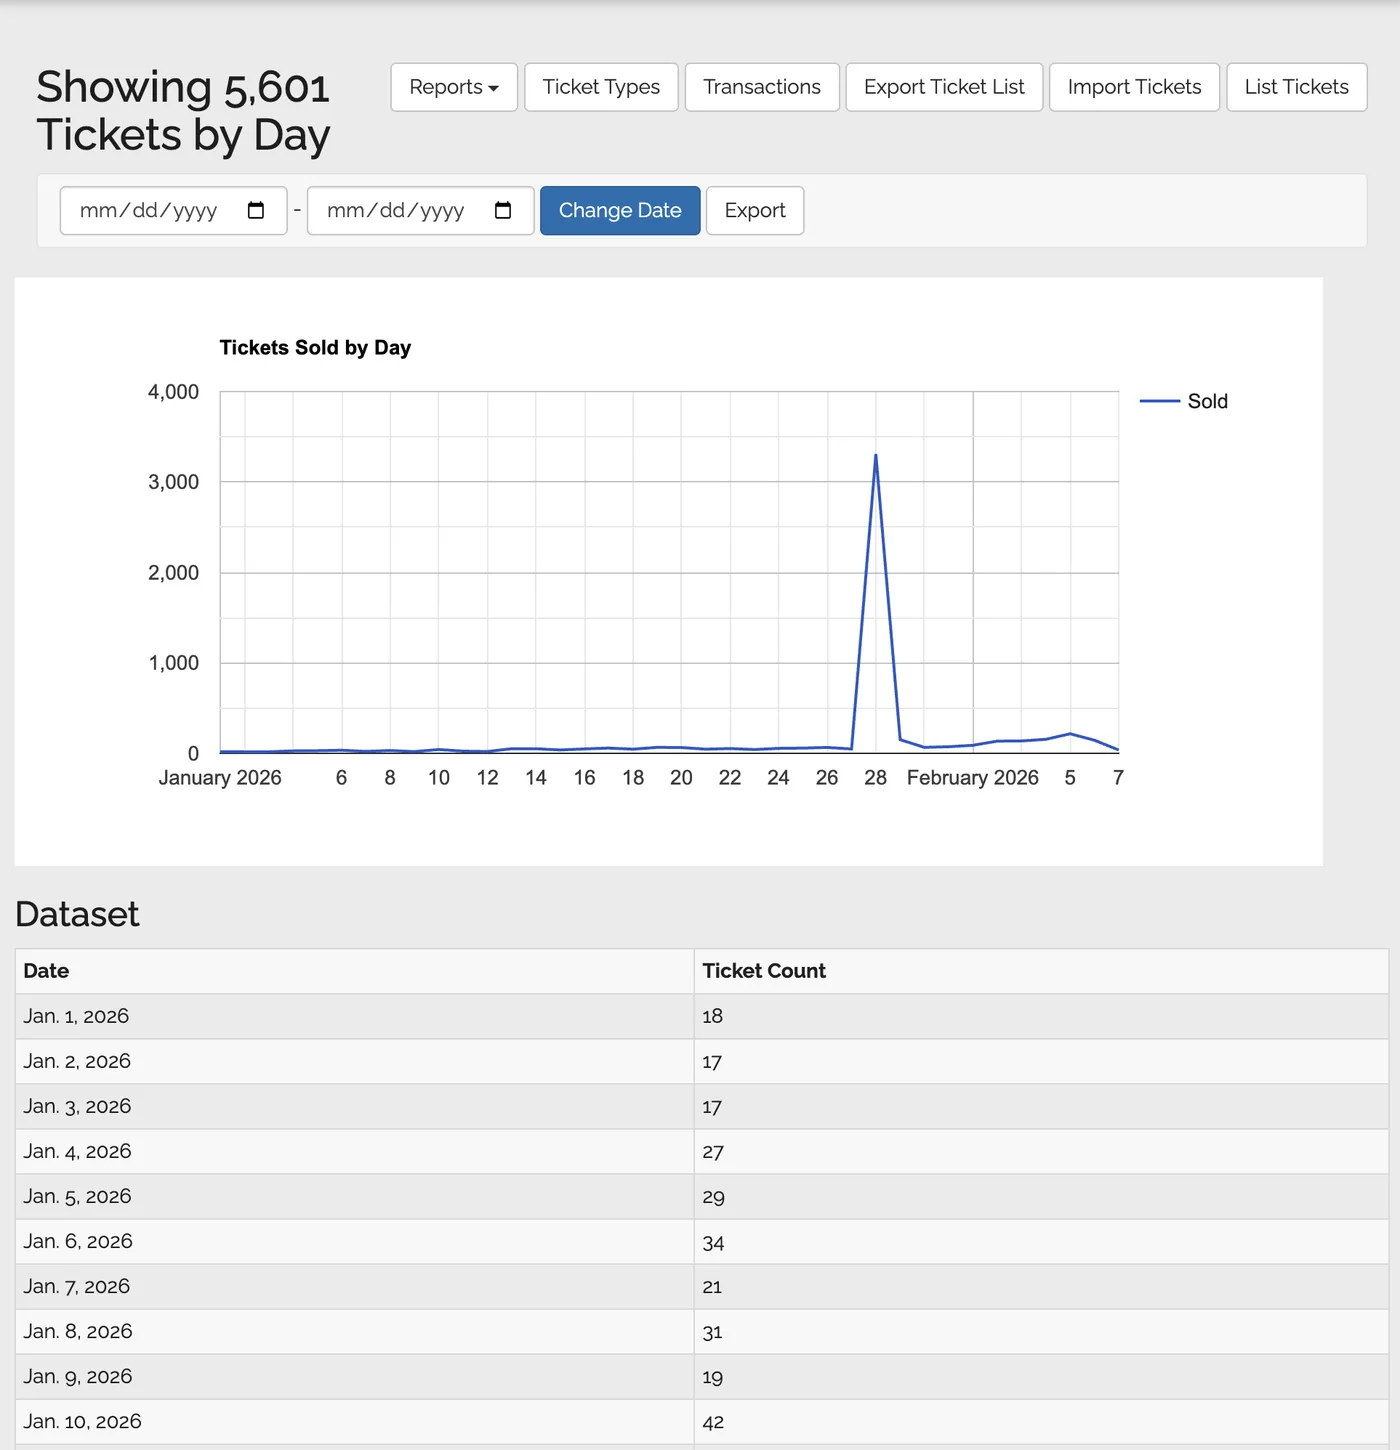
Ticket Sales by Day Report screenshot
📅 Ticket Sales by Day
Page shows:Tickets sold per day in the selected range
How to read:Identify which days marketing drove the most sales
Export includes: CSVDate, Ticket Count
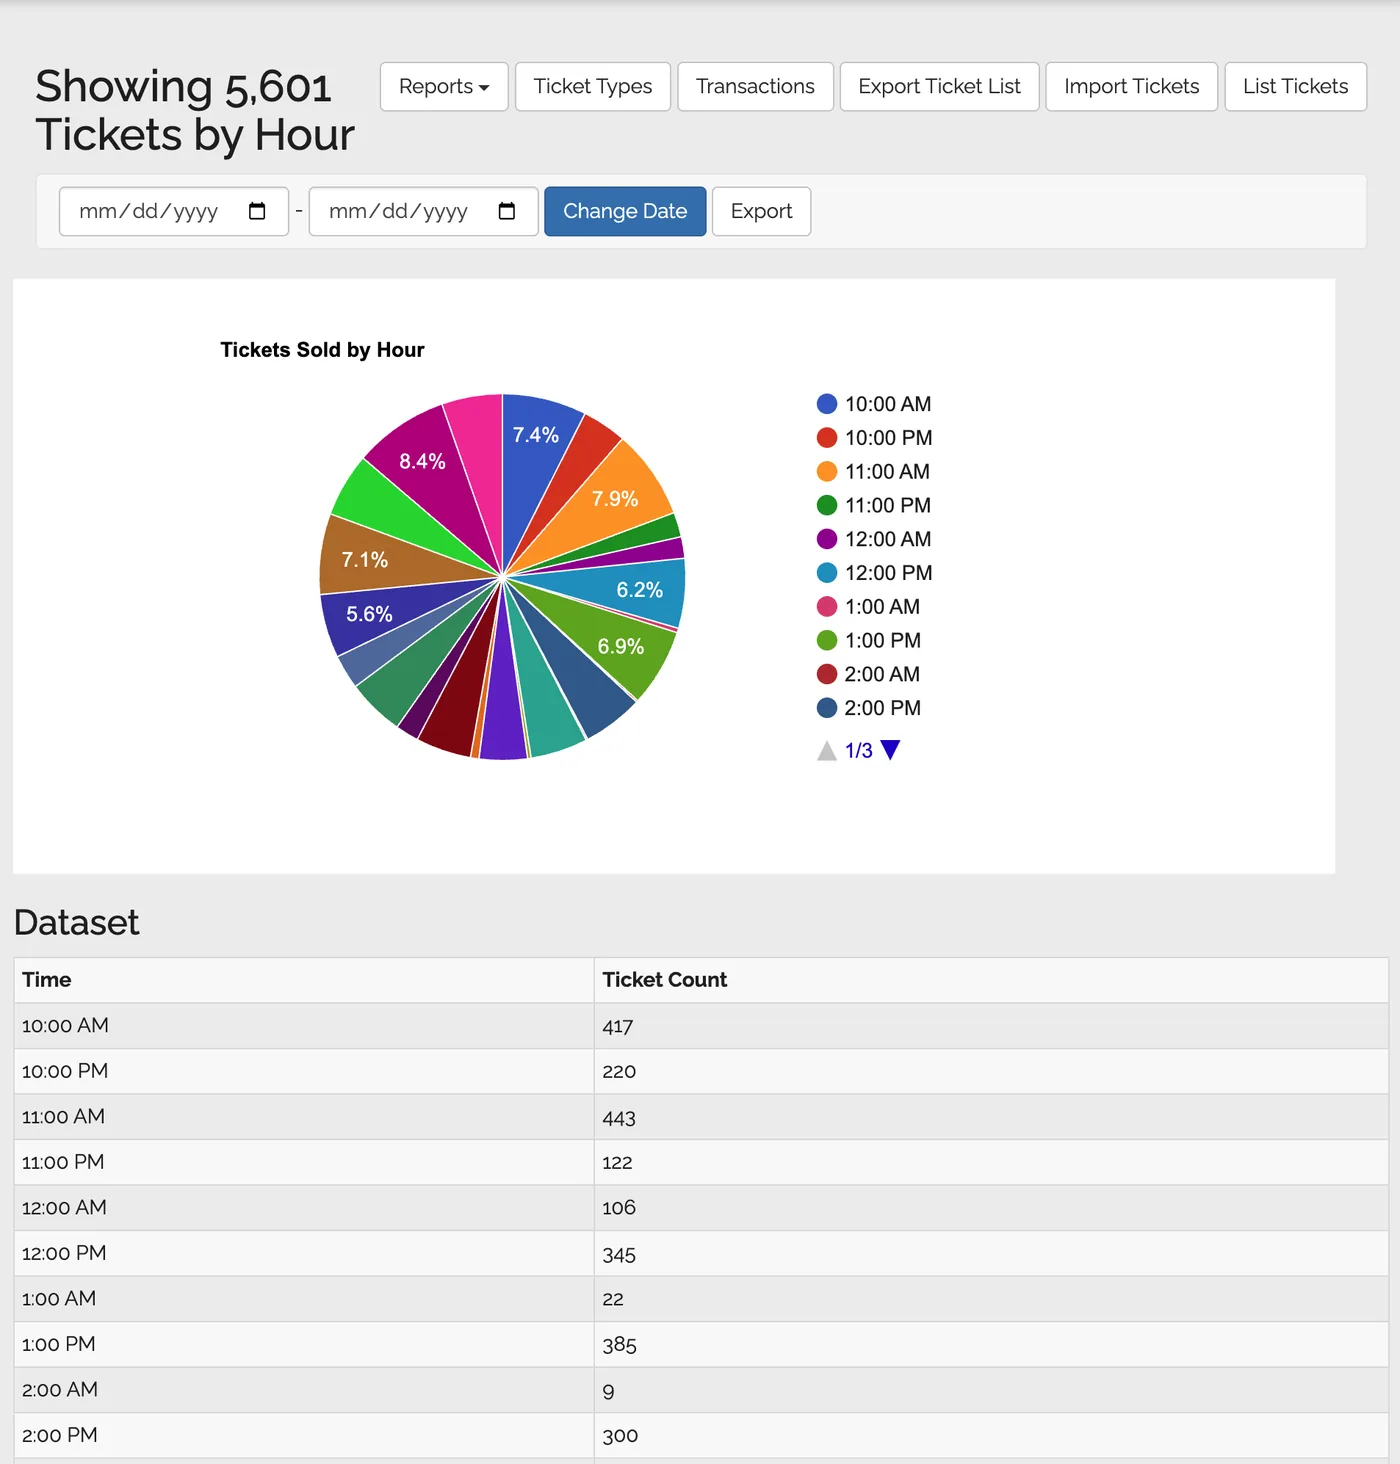
Ticket Sales by Hour Report screenshot
🕐 Ticket Sales by Hour
Page shows:When during the day tickets were purchased (Mountain Time)
How to read:Great for timing email campaigns — see if your 9am email moved sales
Export includes: CSVTime, Ticket Count
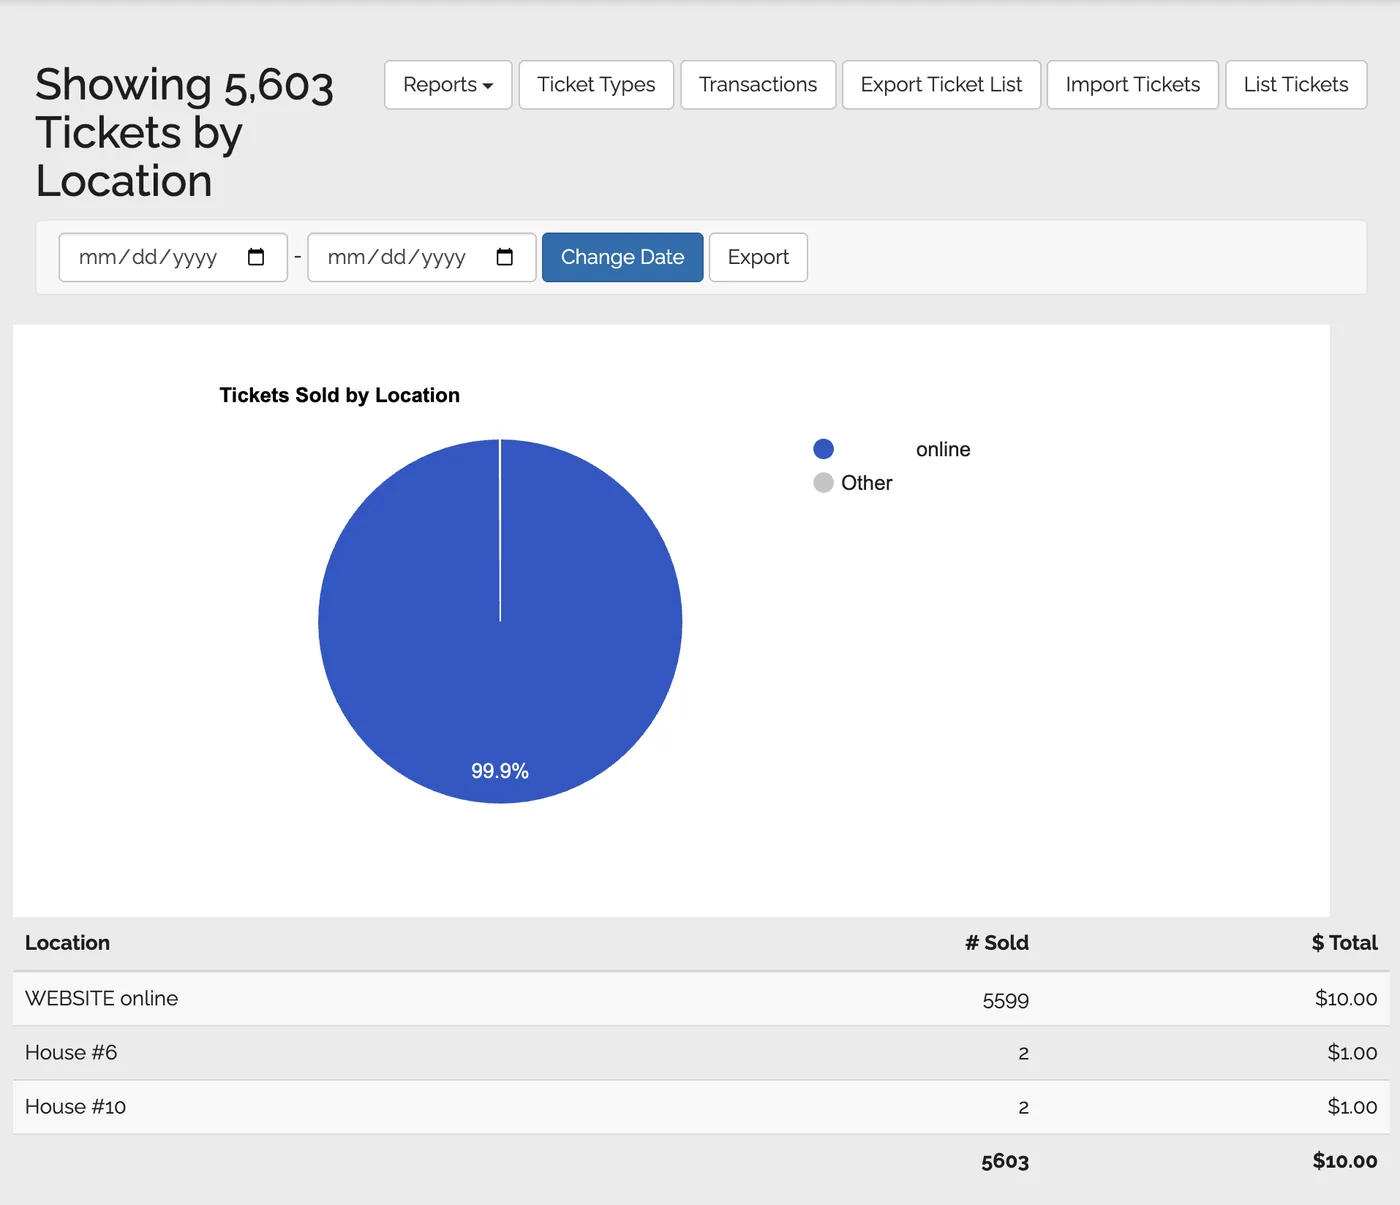
Ticket Sales by Location Report screenshot
📍 Ticket Sales by Location
Page shows:Where ticket purchasers are coming from geographically
How to read:Use for demographic insights and sponsor reporting on reach
Export includes: CSVLocation, Tickets Sold, $ Total
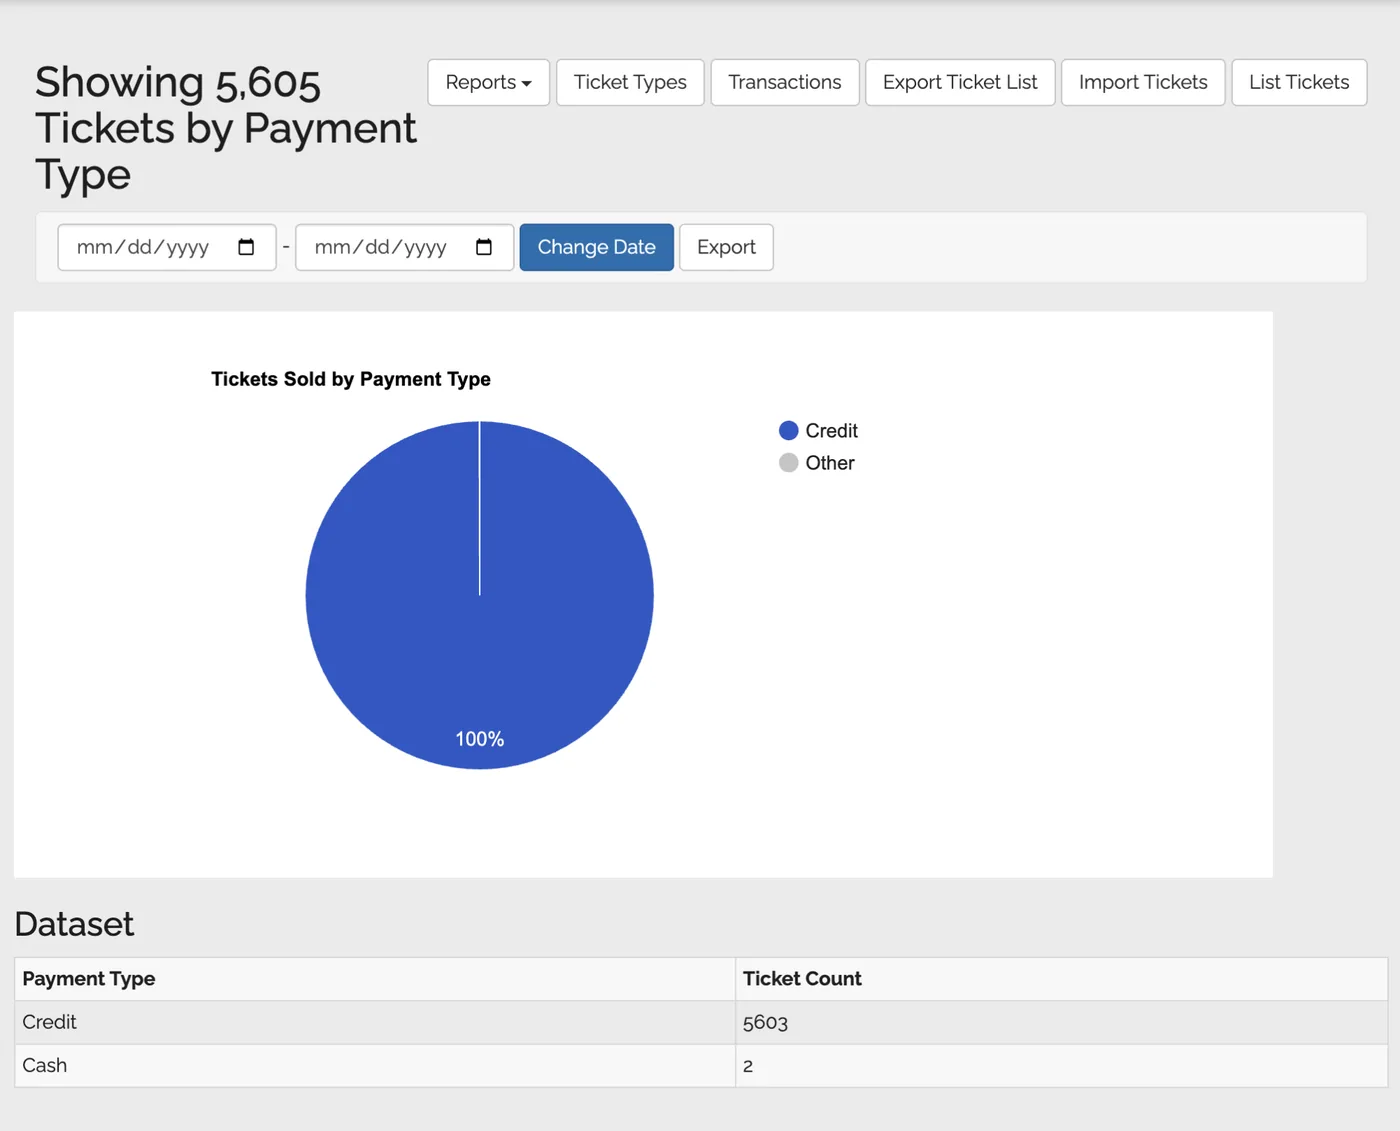
Ticket Sales by Payment Report screenshot
💳 Ticket Sales by Payment
Page shows:Sales summarized by payment method and status
How to read:Use to reconcile payments and understand how attendees prefer to pay
Export includes: CSVPayment Type, Ticket Count
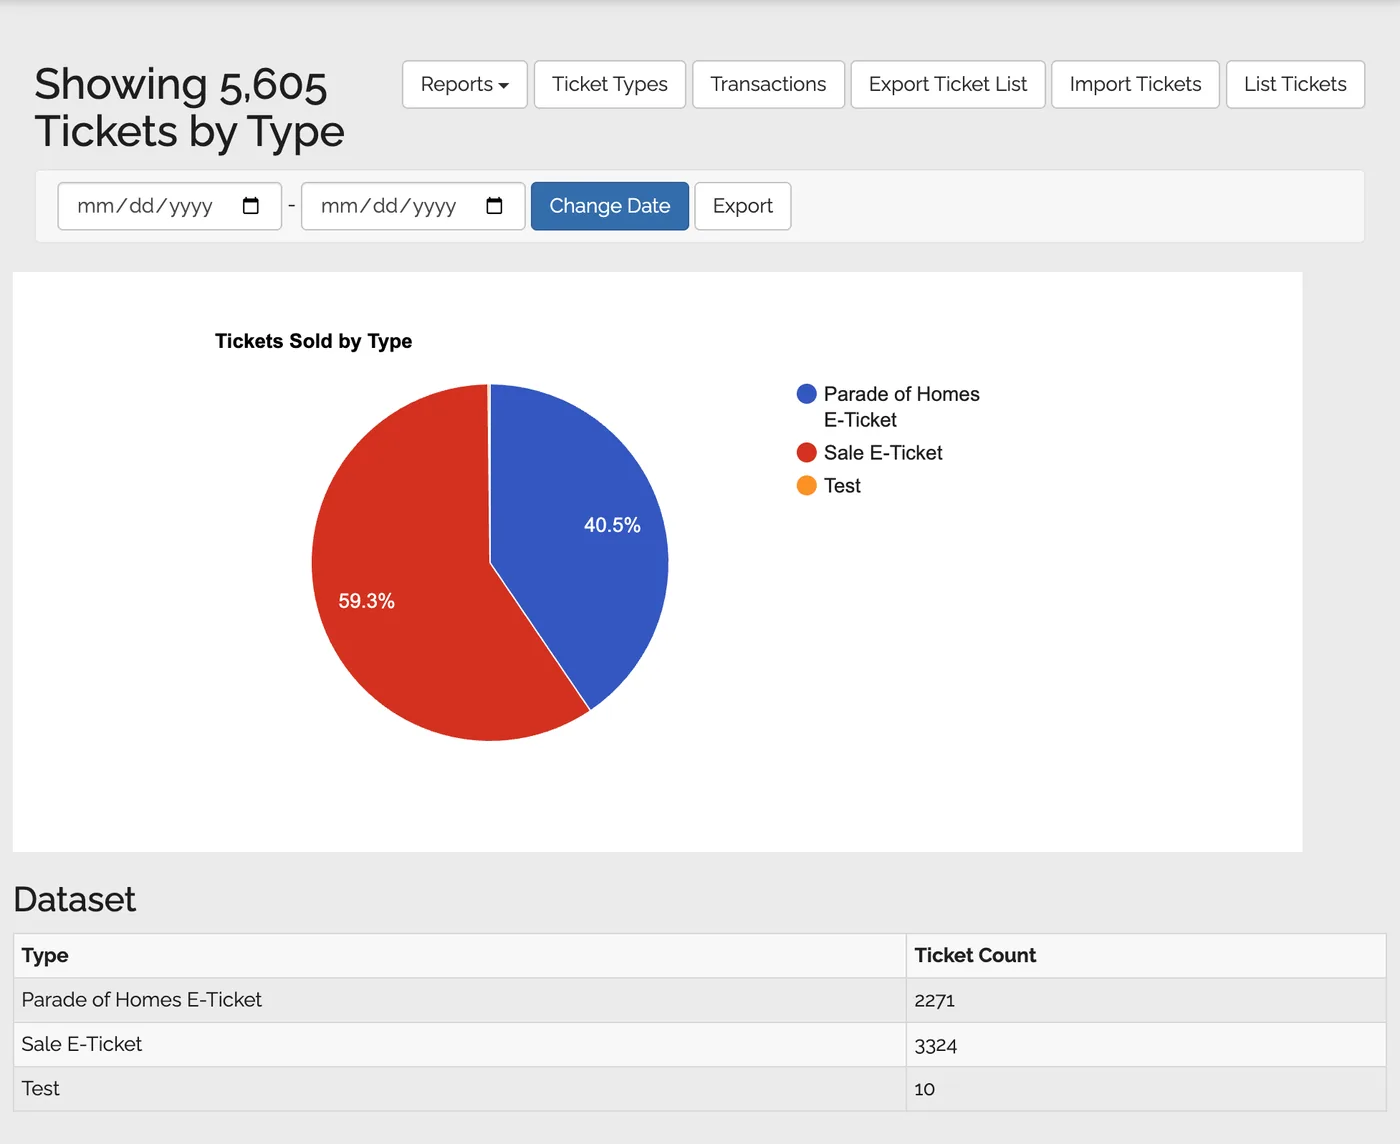
Ticket Sales by Type Report screenshot
🎟️ Ticket Sales by Type
Page shows:Sales grouped by ticket type (Adult, Child, VIP, etc.)
How to read:See which ticket types are most popular; track VIP vs general admission
Export includes: CSVTicket Type, Ticket Count
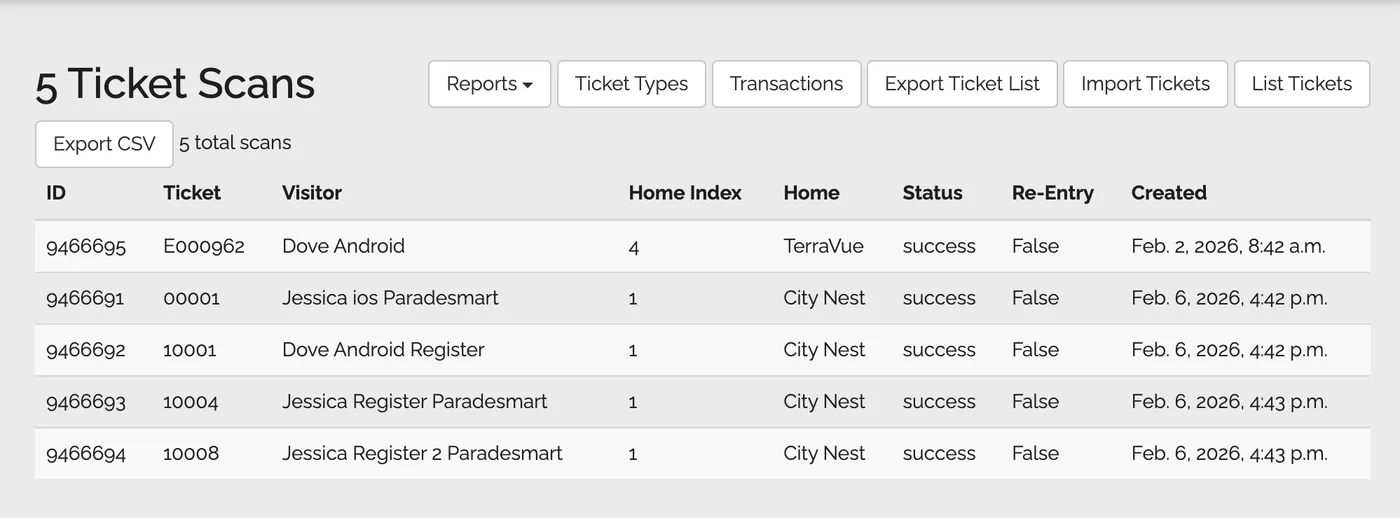
Ticket Scans CSV Report screenshot
📲 Ticket Scans CSV
Page shows:Export-focused view for raw scan activity
How to read:Use for detailed analysis of individual scan events
Export includes: CSVTicket ID, eticket number, Visitor, Home Index, Home Name, Status, ReEntry, Created (scan time)
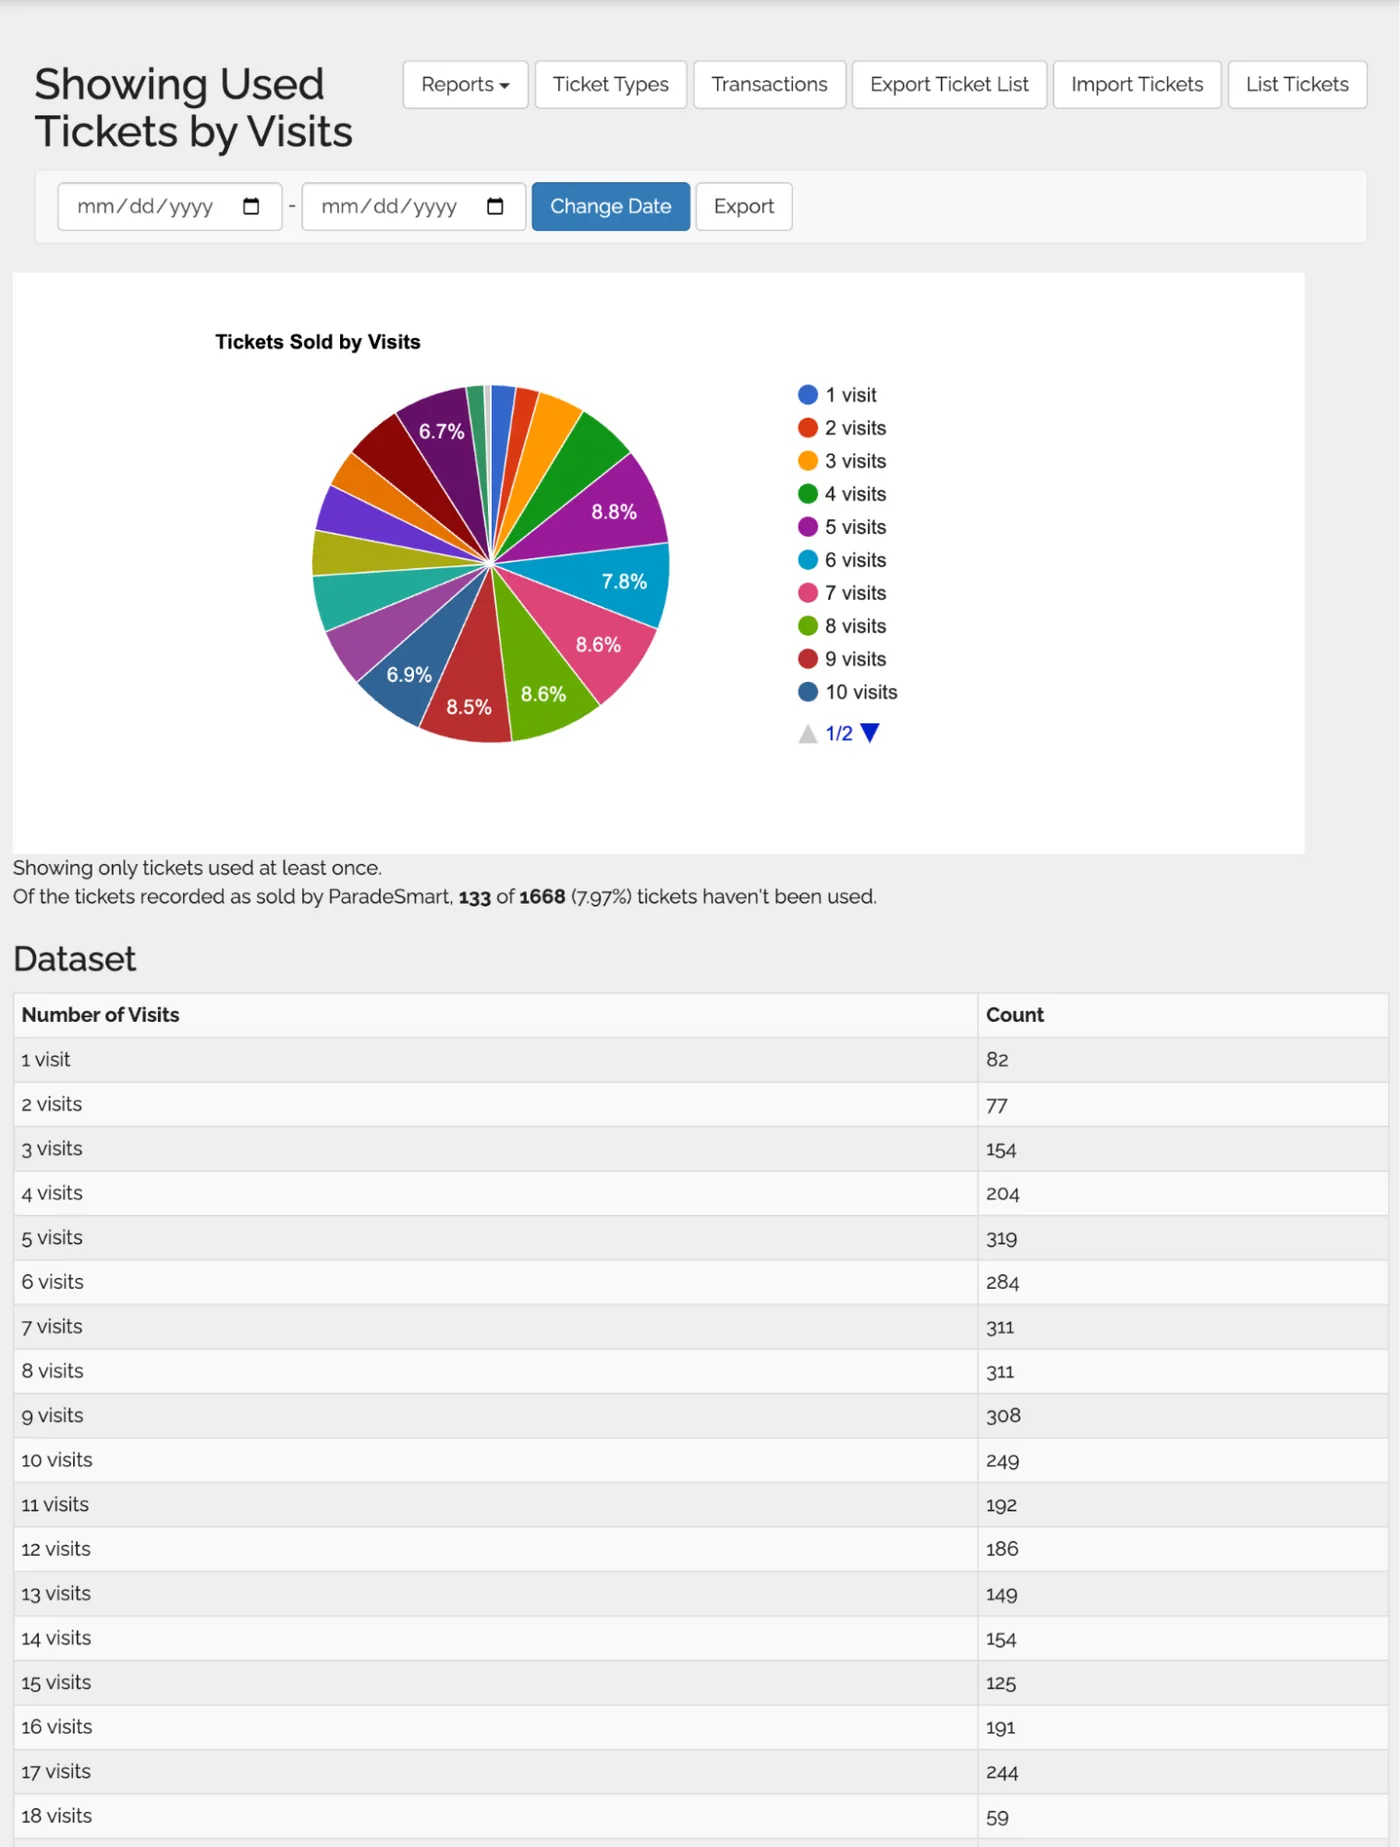
Ticket Visits Report screenshot
🏠 Ticket Visits Report
Page shows:How many tickets had 1 visit, 2 visits, 3 visits, etc.
How to read:Understand how deeply attendees engaged — how many homes the average visitor toured
Export includes: CSVNumber of visits, Count
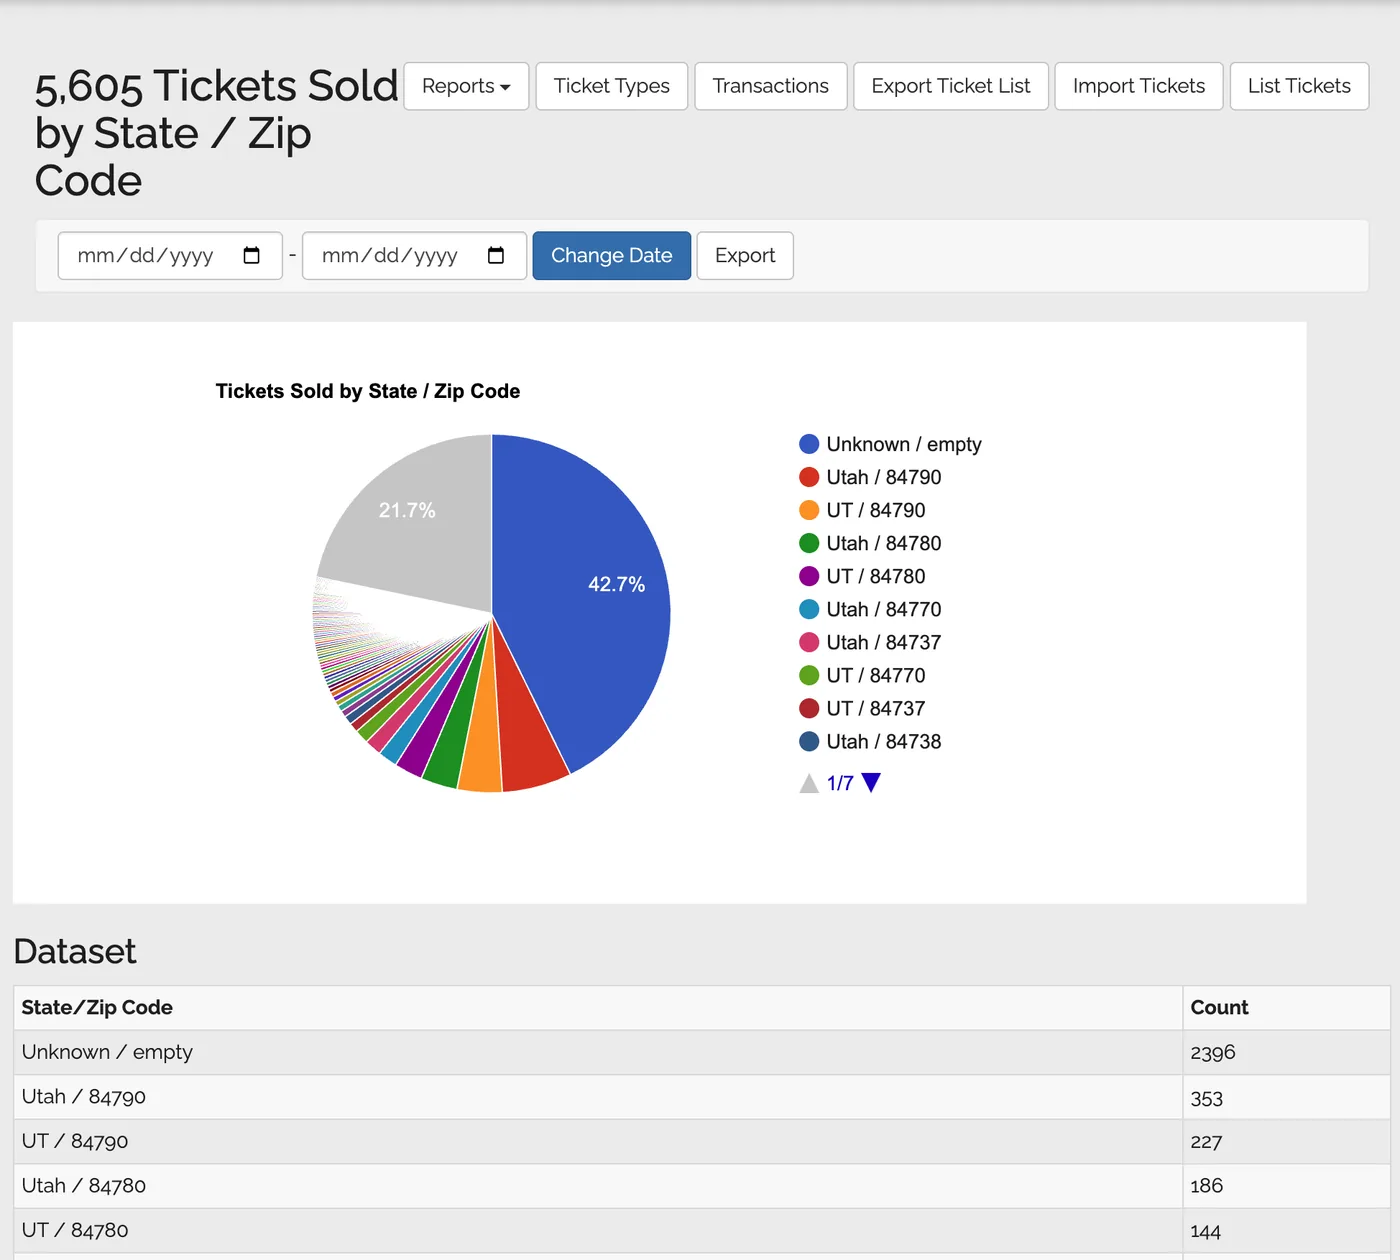
Tickets by Zip Code Report screenshot
🗺️ Tickets by Zip Code
Page shows:Ticket activity by zip code
How to read:Marketing insights and sponsor demographics — where did attendees come from?
Export includes: CSVState/Zip Code, Count
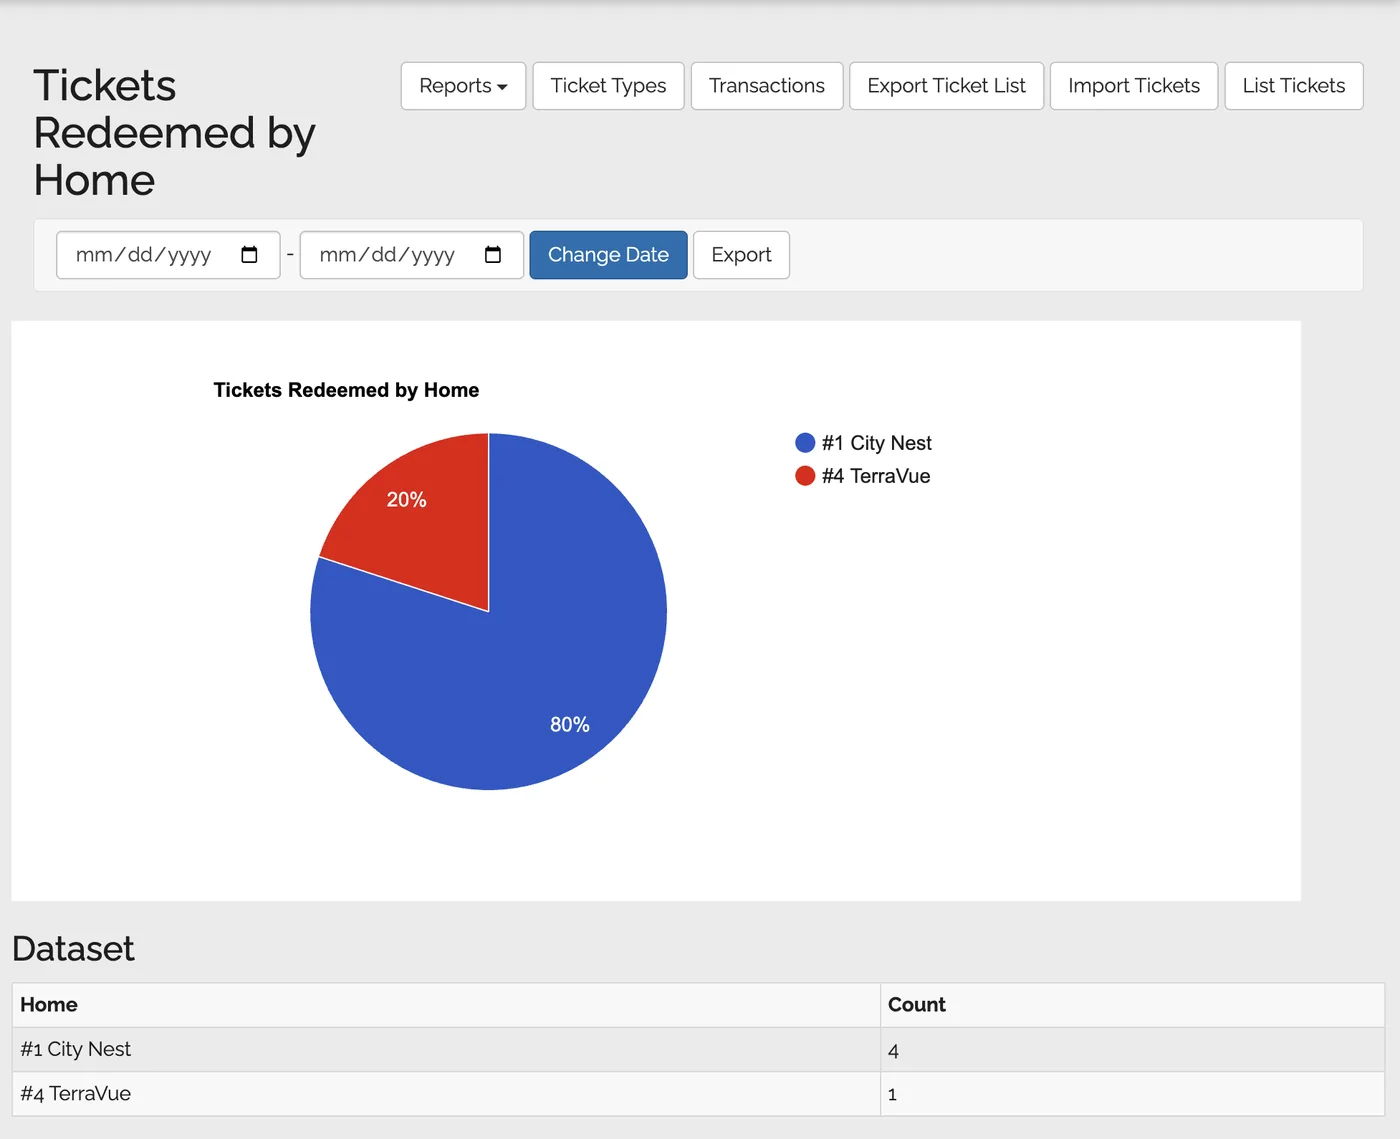
Tickets Redeemed by Home Report screenshot
🏡 Tickets Redeemed by Home
Page shows:Ticket redemptions grouped by home
How to read:Compare foot traffic between homes — which homes had the most visitors?
Export includes: CSVHome, Count
Tickets Scanned Report screenshot
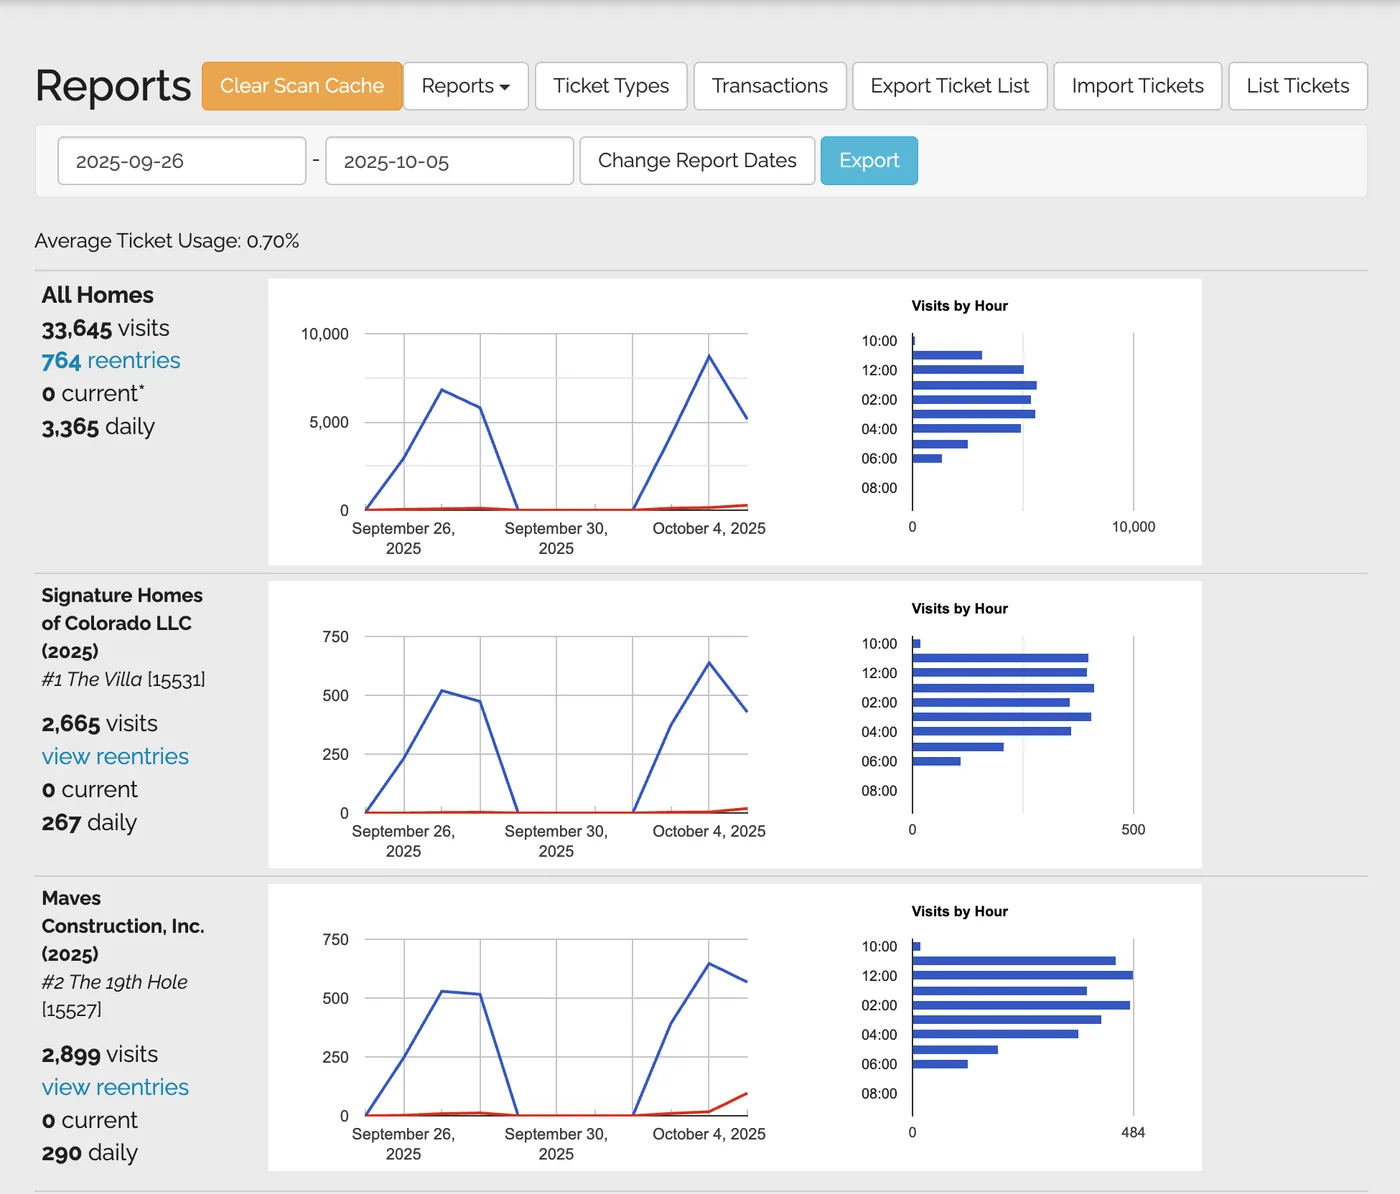
📊 Tickets Scanned Report
Page shows:Scan totals overall and by home
How to read:Use overall totals for attendance numbers; by-home view for traffic comparisons between builders
Export includes: CSVIndex, Name, Builder, Date, Total Entries, Reentries
Tickets Sold Report screenshot
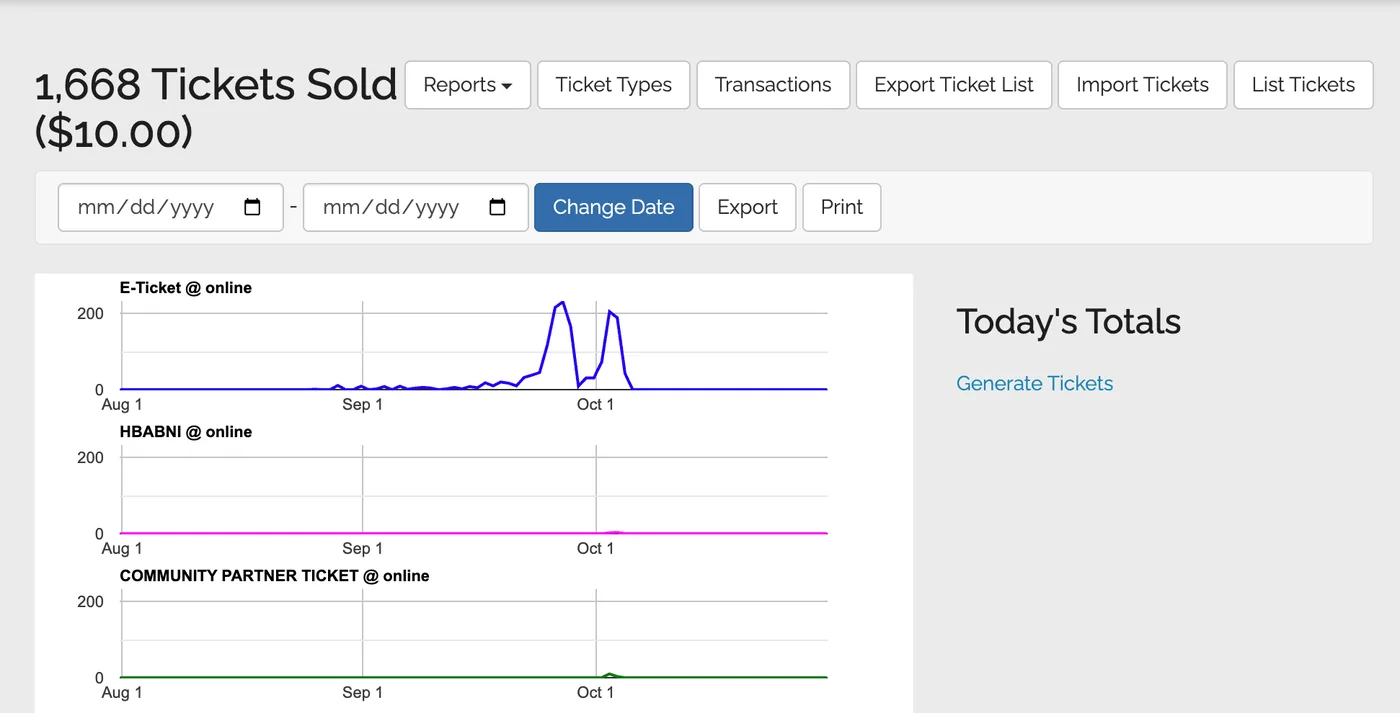
🧾 Tickets Sold Report
Page shows:Ticket buyer demographics and full purchase details
How to read:Totals may include free/comp tickets — some dashboard figures only count paid tickets. Check both carefully.
Export includes: CSVTicket, Type, Transaction ID, Price, Fee, Donation, Name, Email, Phone, Postal, Gender, Age, Household Income, Occupation, Own Home, Future Plans, Referrer, Sale Location, and more
Visitors by Home Report screenshot
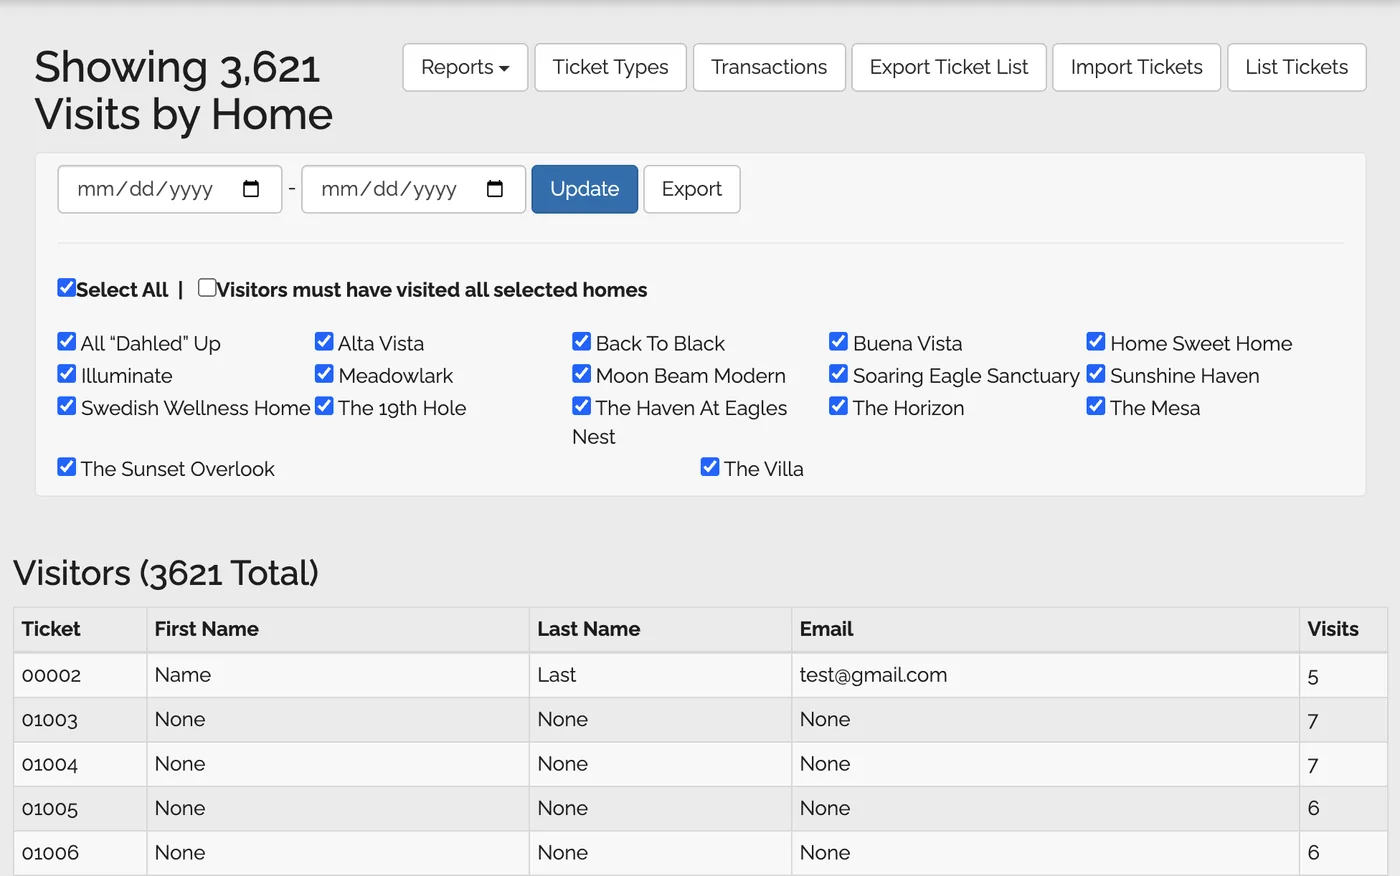
👣 Visitors by Home Report
Page shows:Visit data from the visitor/ticket perspective
How to read:Best for understanding how individual visitors moved through the parade
Export includes: CSVTicket, First Name, Last Name, Email, Visits Count
✉️ Visitors with Email Opt-In
Page shows:Visitors who opted in to receive emails from your HBA
How to read:Use for post-event email follow-ups and newsletter list building
Export includes: CSVTicket, First Name, Last Name, Email, Visits
⚠️
Demographic fields require setup by ParadeSmart

Reports like Tickets Sold include columns for Age, Gender, Household Income, and Occupation — but these only contain data if demographic questions were added to your checkout flow. Contact us to add them if you haven't already.

📥 Master Export (Homes Tab)

The Master Export is separate from the Reports section and lives in the Homes tab. It exports a complete list of all homes and their subcontractors.

  1. Go to the Homes tab in the Web Manager
  2. Click Master Export in the top right corner
  3. The export includes all homes and associated subcontractors
⚠️
Hidden homes won't appear in the export

If homes are marked Hidden, they will be excluded from the Master Export. Unhide them first if you need a complete list.